
On December 31st, 2016, the Houston Rockets hosted the New York Knicks for a regular season NBA game in Texas' Toyota Center. Although the Rockets started the game as favorites having a 26-9 record at that point in the season, New York (16-17) was able to put on a good performance during practically all of the first half of the game.
The problem for the Knicks (apart from the absence of their star big-man Kristaps Porzingis and starter Courtney Lee) was no other than the presence of James Harden, who was able to achieve a performance for the ages. The now-point guard of the Rockets became the first NBA player ever to get a 50-plus point, 15-plus assists, 15-plus rebounds triple double. He finished the game with 53 points, 16 total rebounds and 17 assists.
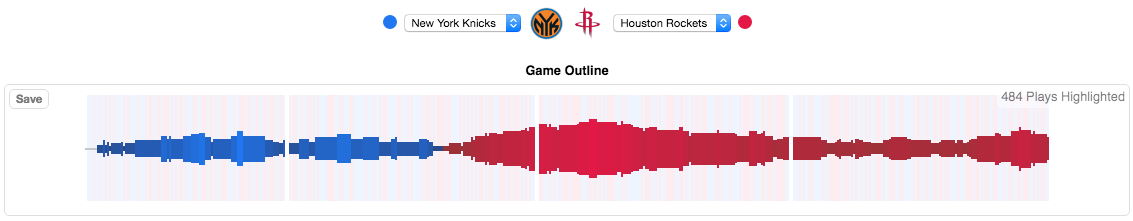
On New York's account, the startling performance of Brandon Jennings (32 points, 7 assists, 5 rebounds) was not enough to stop Houston, even though the Knicks were close to upset the Rockets late in the fourth quarter as can be seen in the Game Outline atop, being just 4 points away of a comeback on multiple occasions.
By plotting the performances of different players in the shape of radar charts in BKViz, we can actually see how Harden outperformed any other player in the match.
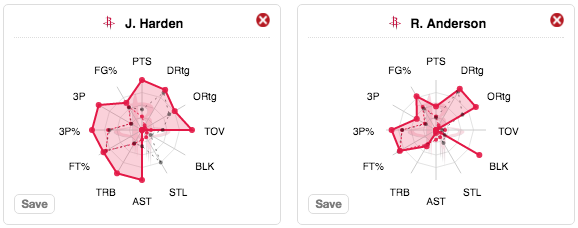
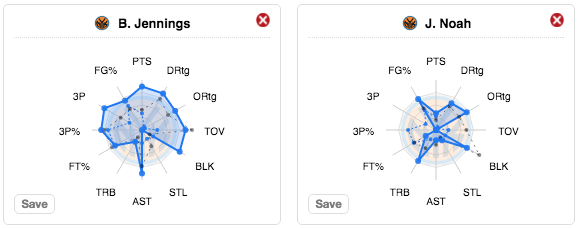
Harden led his team during the full match and finished the game at the top of practically every statistical category, of course on every of those usually dominated by players at his same position such as points, shooting percentages and assists. The same goes for Jennings over his Knicks' teammates, although if compared between them, Harden clearly surpassed Brandon Jennings performance in the game by far.
In any case, both players were able to carry their teams during most of the match, which can be easily spotted by taking a quick look at the radar charts, which clearly show much bigger areas for the named players than those of the rest (like Anderson or Noah, whose colored areas are way smaller in comparison, depicting worse outcomes). It is also worth noting how James Harden outperformed his own averages, which are known thanks to the gray dotted area of the chart.
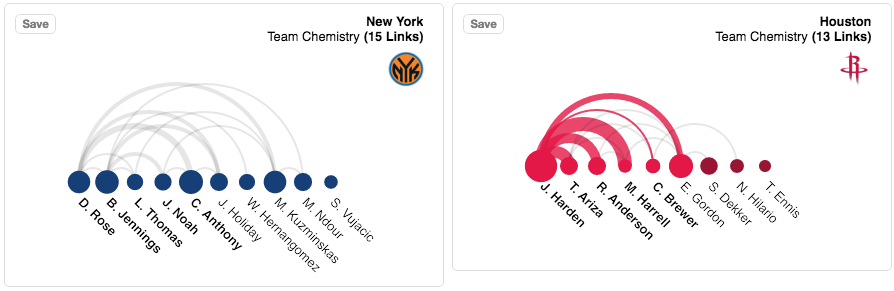
Another way to look at the game development is from the Team Chemistry point of view, this is, the relations between players in terms of assists given and facilitated baskets in the tool. This can be explored through the charts depicted in the figure above.
Both New York and Houston present practically the same links (15 to 13), the distribution is quite different. While New York players shared the ball in a somewhat evenly way (with playmakers such as Rose and Jennings having the most links), Houston relied mostly on Harden during the game in order to take advantage of his above-average performance.
The charts were also configured to show the usage ratio of each player in the context of the game, which can be seen by the radio of each bubble. This way is easy to see how James Harden was by far the most used player of the 19 players taking part in the match. Harden finished 40.6% of his team's plays (either by shooting or losing the ball committing a turnover). He was followed (although with great distance) by Eric Gordon (27%) Carmelo Anthony (26.7%), which highlights how high was his involvement in this particular game.
Knowing this, New York could have tried to double-team him in defense in order to prevent further damage given the one-dimensional attacking approach of Houston. Even with that, they failed to contain James Harden, who was able to thrive through the whole game.
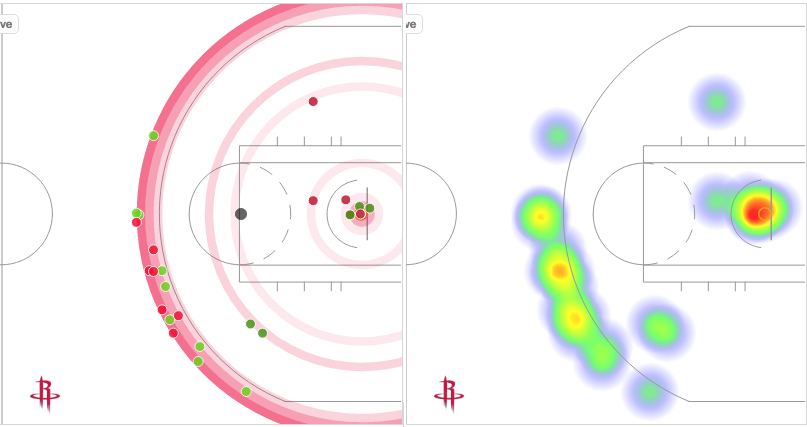
One of the most incredible feats achieved by James Harden during this game was getting to score 53 points, which he did in 26 attempts while shooting .538 from the field and .563 (9 of 16) from the 3-point line. Given the style of play employed by Houston (high-value three pointers, corner shots and near-the-rim attempts), Harden's shooting fitted the bill quite nicely, as can be seen in the figure above.
First of all, by looking at the heat map on the right side of the image, it is easy to appreciate how James Harden shot primarily from the outside and near the rim, with just a couple of spots between those areas highlighted in between. To get more detail of the shooting performance of Harden, his Shooting Fingerprint and exact shot locations were plotted. In them (left image) we can see how there were only four attempts by Harden between the restricted area near the rim and the three point line (considered low-value spots) but how even half of those tries ended in baskets. On the long-rage side of things, it can also be spotted a tendency of shooting from the right wing, from where James shot the ball 12 times (in comparison to three from the top of the key and one from the right wing). Surprisingly, although possibly related to his point guard duties, no corner threes were shot by him during the time he was on the court.
This brief analysis, made possible thanks to BKViz, shows how great James Harden's performance was on New Year's Eve against the New York Knicks and how he was able to make history putting up unprecedented numbers. Harden's tied Wilt Chamberlain for the most points in a triple-double with 53, scored more 3-point field goals (9) than he had ever done in his career and set the record in a triple-double too, and through three quarters he already had 40 points, 13 rebounds and 13 assists, becoming the only player in the past 20 years to get 40 points and 10 assists during the first 36 minutes of a game (let alone the 10+ rebounds added to that).
You can learn more about BKViz here.