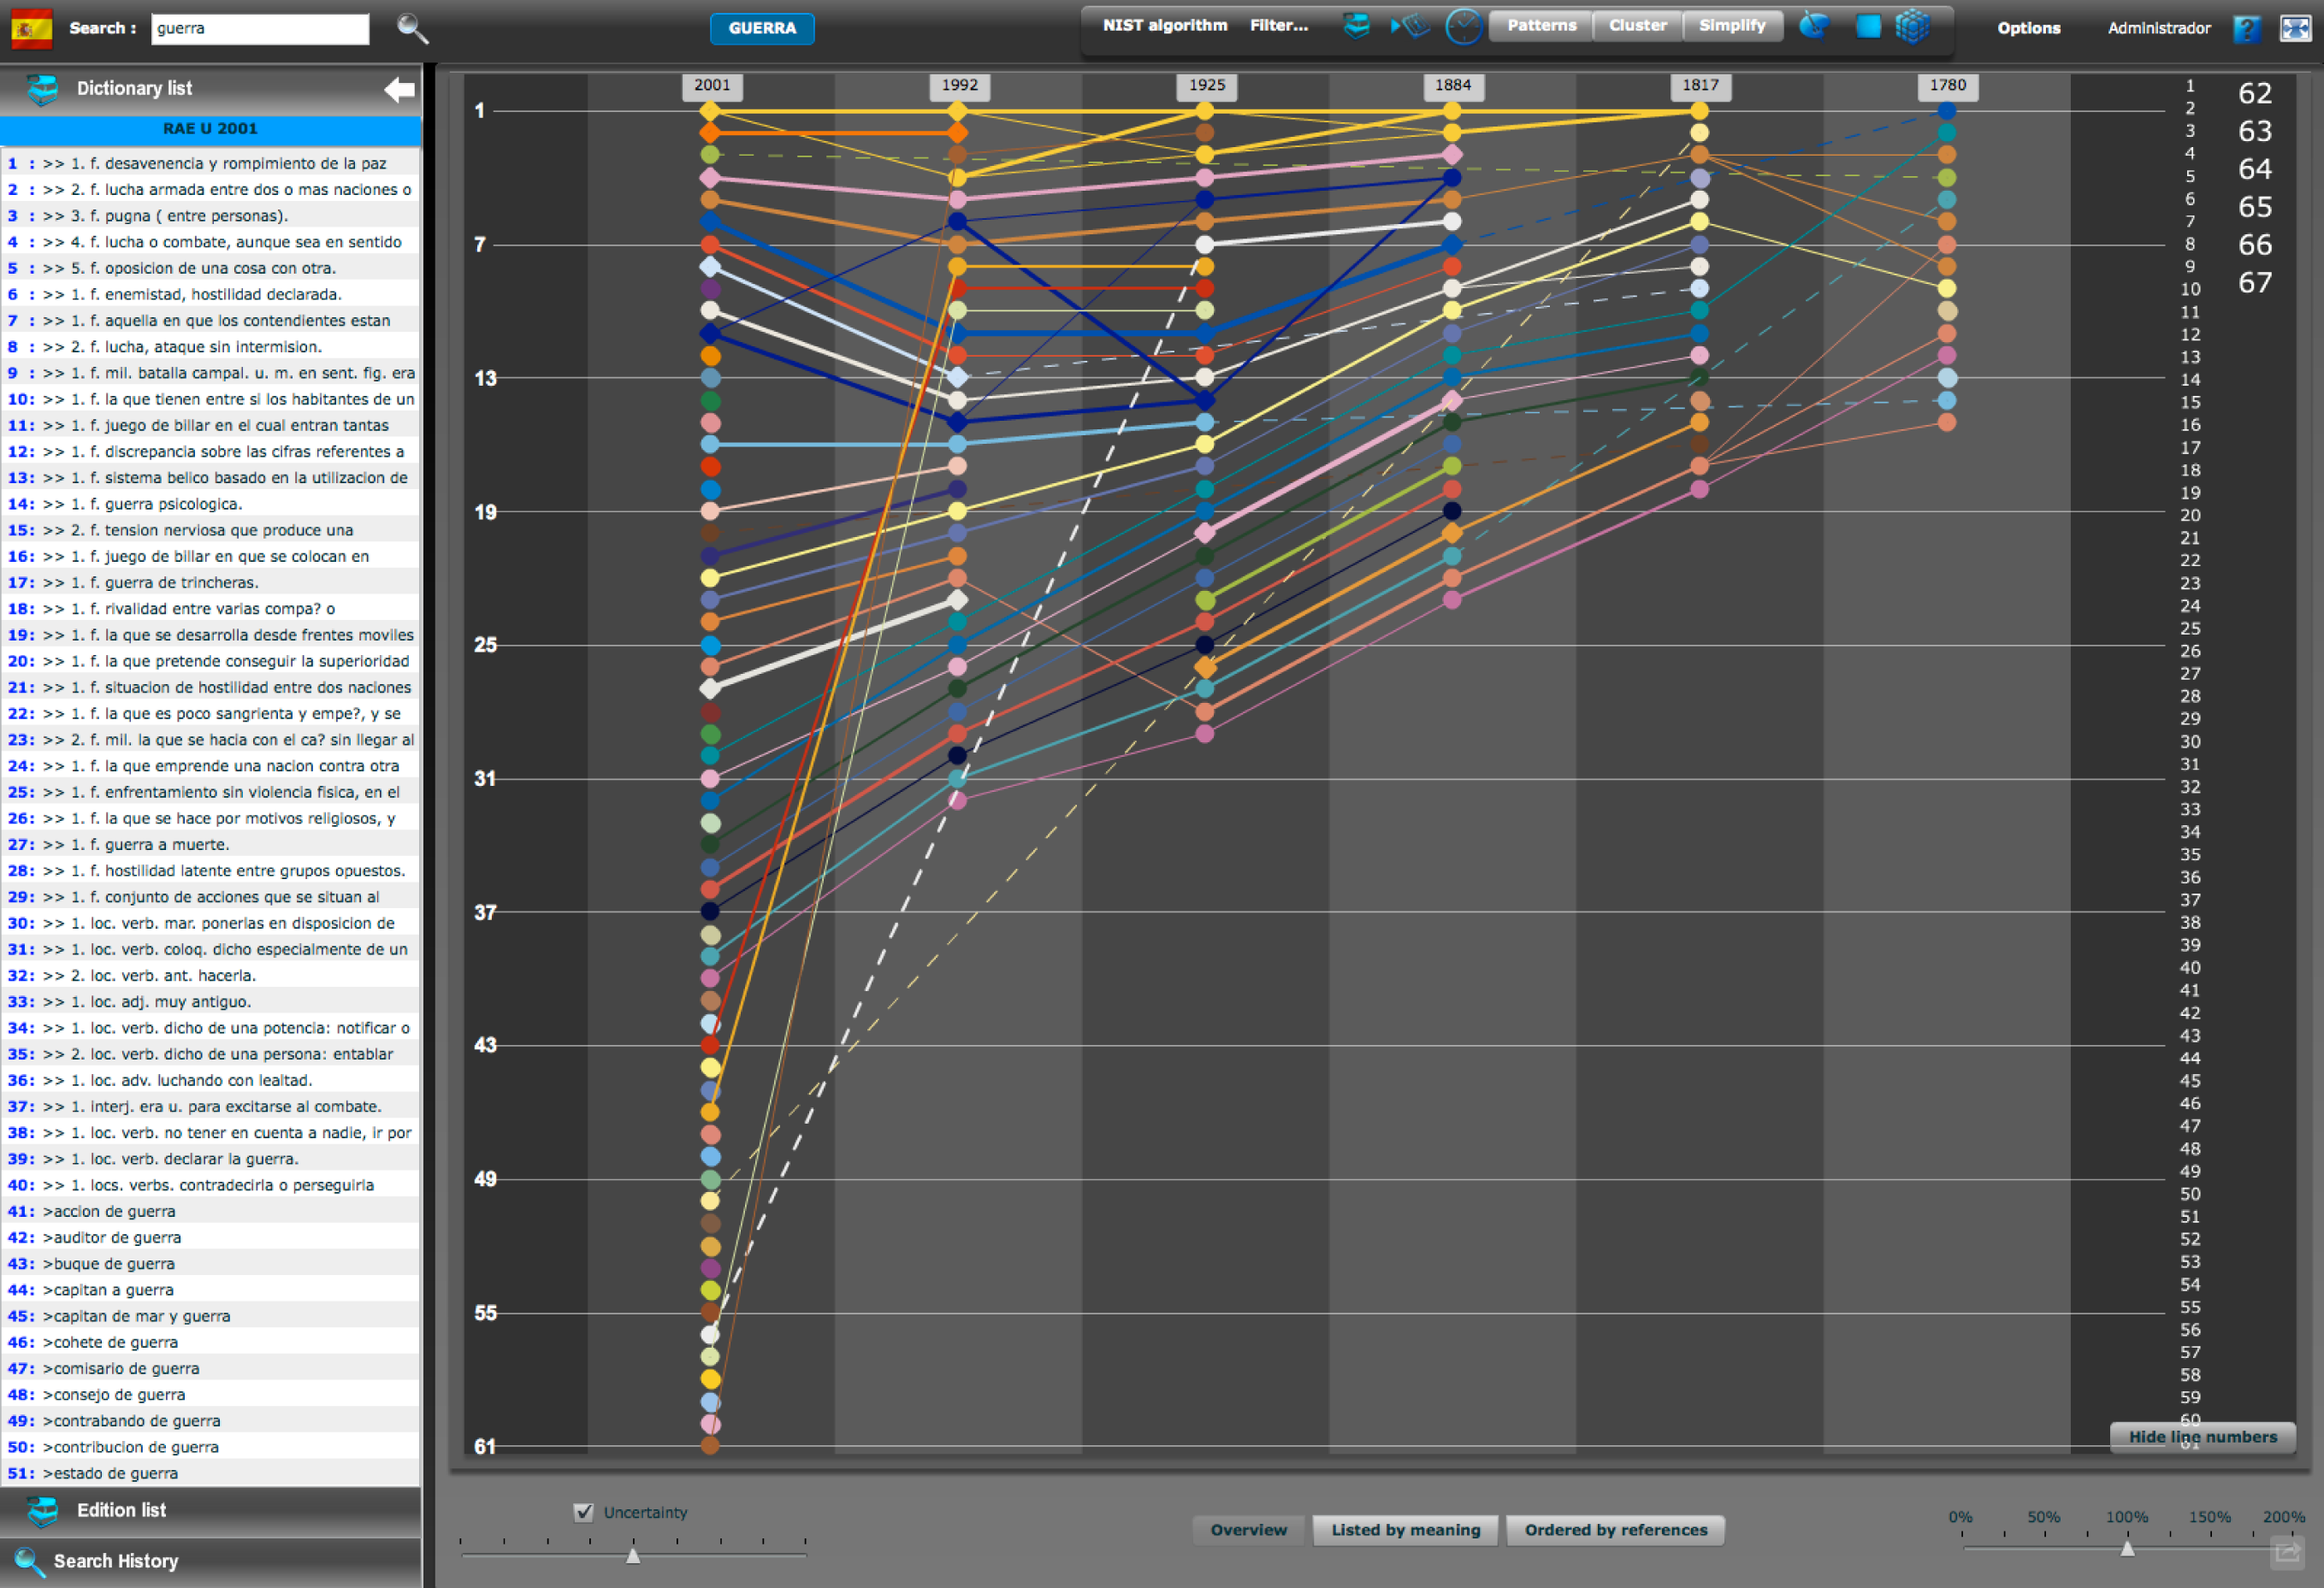
The field of computational linguistics has been dealing with the modeling of natural language from a computational perspective since the 1950s. However, the usage of advanced and interactive visualization techniques is very limited. This is especially the case of diachronic linguistics, which is devoted to the study of language change. This work is part of a project that aims to provide novel highly interactive visual solutions to ease the task of lexicographers, ensuring a rigorous treatment of the vocabulary beyond the use of traditional lexicographic sources and overcoming certain limitations of corpus linguistics. This article focuses on the choices made for the design and development of an interactive visual tool that supports different tasks related to the processes of drawing up and consulting historical dictionaries. Particularly, we describe solutions for the exploitation, analysis, and expert-directed validation of the data compiled in the available dictionaries in a manner that is both automatic (provided by computational methods) and intelligent (provided by the experts). We thus describe diachronlex diagrams, an interactive visual solution that facilitates linguistic work related to the understanding of the temporal evolution and the lexical relationships between the different meanings registered in subsequent editions of a dictionary.
Information Visualization
Published online before print July 12, 2013, https://doi.org/10.1177/1473871613495844 Information Visualization July 12, 2013
